It’s not often I do a write up but I had so much fun with this project I had to share. So sit down, grab your coffee, it is story time!

The Objective Link to heading
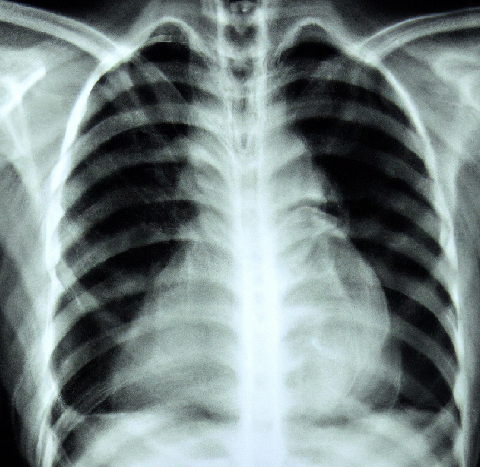
The company I work for is currently undergoing a picture archiving and communication system (PACS) migration. In short, that means we are moving a decade+ of imaging studies such x-rays, CT’s, ultrasounds, MRI’s and more over to a new platform. A whole lot of data!
Naturally, we must find a way to keep tabs on such a lengthy process. We want to ensure exams continue to flow smoothly into the new system with the discovery of bottle necks as they occur. So, what do we have to work with?
Great question! We have every system engineer’s favorite, a log file! But like any log, we need to chop this thing down into useful components. It’s time to grab the chainsaw!
Problem # 1 - No Logging Infrastructure Link to heading
First we need some infrastructure but I don’t have time to stand up a bunch of dedicated servers. Let us expedite this process and jump into the world of Docker containers. We will specify our requirements in a docker-compose YAML file.
We need:
- Prometheus - collect metrics in a time series database
- Grafana - the dashboard
- Loki - to manage the log file
Additionally, we will add some folders into the YAML file directory for persistent storage. We don’t want our hard work to vanish on a restart. Lastly, we will only bind the container ports to a local interface so our metrics and data are protected!
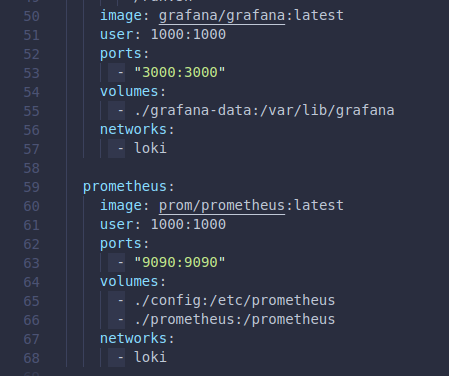
Now with our docker-compose.yaml file created we just issue a single command
docker-compose up -d
And our monitoring infrastructure is up! Let’s take a look at the container performance.
docker stats
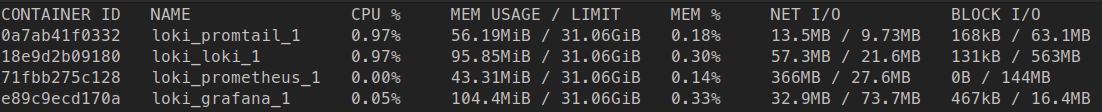
Hey oh! Our monitoring stack is ~300MB. Not too shabby!
Problem # 1 - No time Link to heading
So, after a brief peek into the log file I discovered we have no timestamps. It’s really hard to create a time series without time… Thankfully the Grafana Agent for Loki will take care of polling the file and add timestamps dynamically!
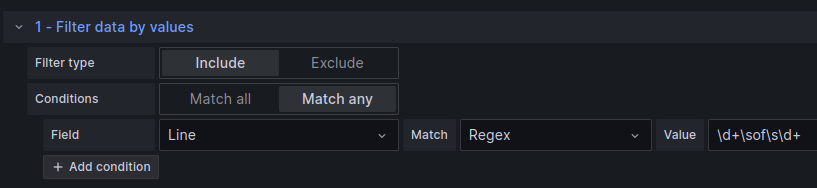
Problem # 2 - The gargantuan log file Link to heading
It may come as no surprise that when moving terabytes worth of data, it generates log files of substantial size. Over 5 million rows a day when running continuously!
So how do we extract the sweet nectar from this log? Regular expressions to the rescue!
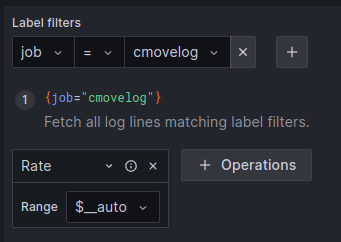
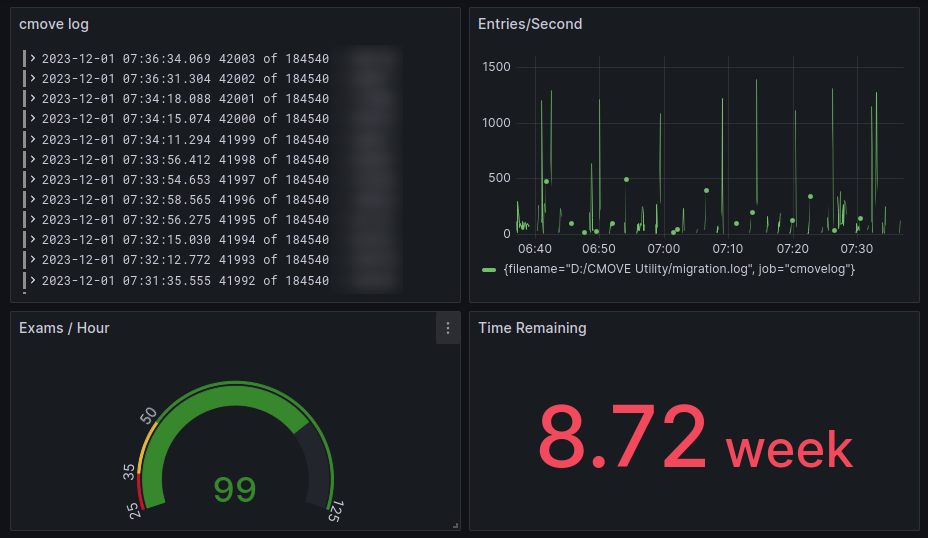
We just need to visit our new monitoring stack so I’ll open up a browser and hit localhost:3000, pop in our expression to find the exam index, and there we go.
Look at how clean this log looks now!
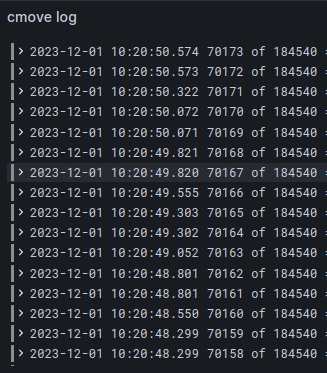
That’s much better. Now we are only seeing the timestamp and the index of the exams being moved.
Problem # 3 - We need visuals, log carving time! Link to heading
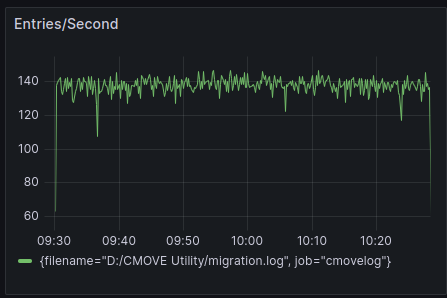
Now that we have a time series, an index, and a data source to query against. Let’s do some carving.
First let’s visualize how the log is growing. We will perform a rate over time expression.
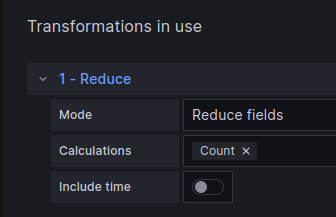
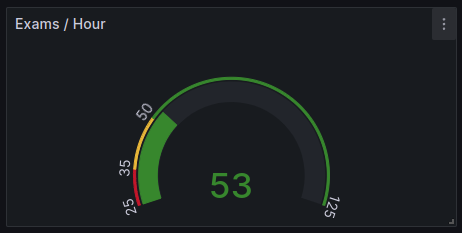
Nice! But now it would be great to know what our exact exam transfer rate is. We will create a new visualization and choose Gauge
We will utilize the same expression as the first visual but we will add a transformation to get a single stat.
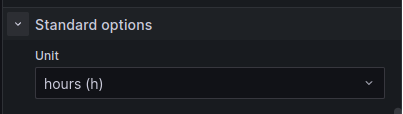
Our last visualization will take the number of exams left divided by the result of the exams per hour. We then set our unit of measure to hours so Grafana will accurately calculate days, weeks, etc.
And there you have it. An enormous log turned into a work of art! We can of course take this much further, but that is for another time.
If you enjoy my content or have questions, please let me know in the comments below. I will be starting a new Youtube series soon that will feature more of my adventures in IT. You can also find me at https://gadgetarmory.com
Thanks for reading! Until next time!